
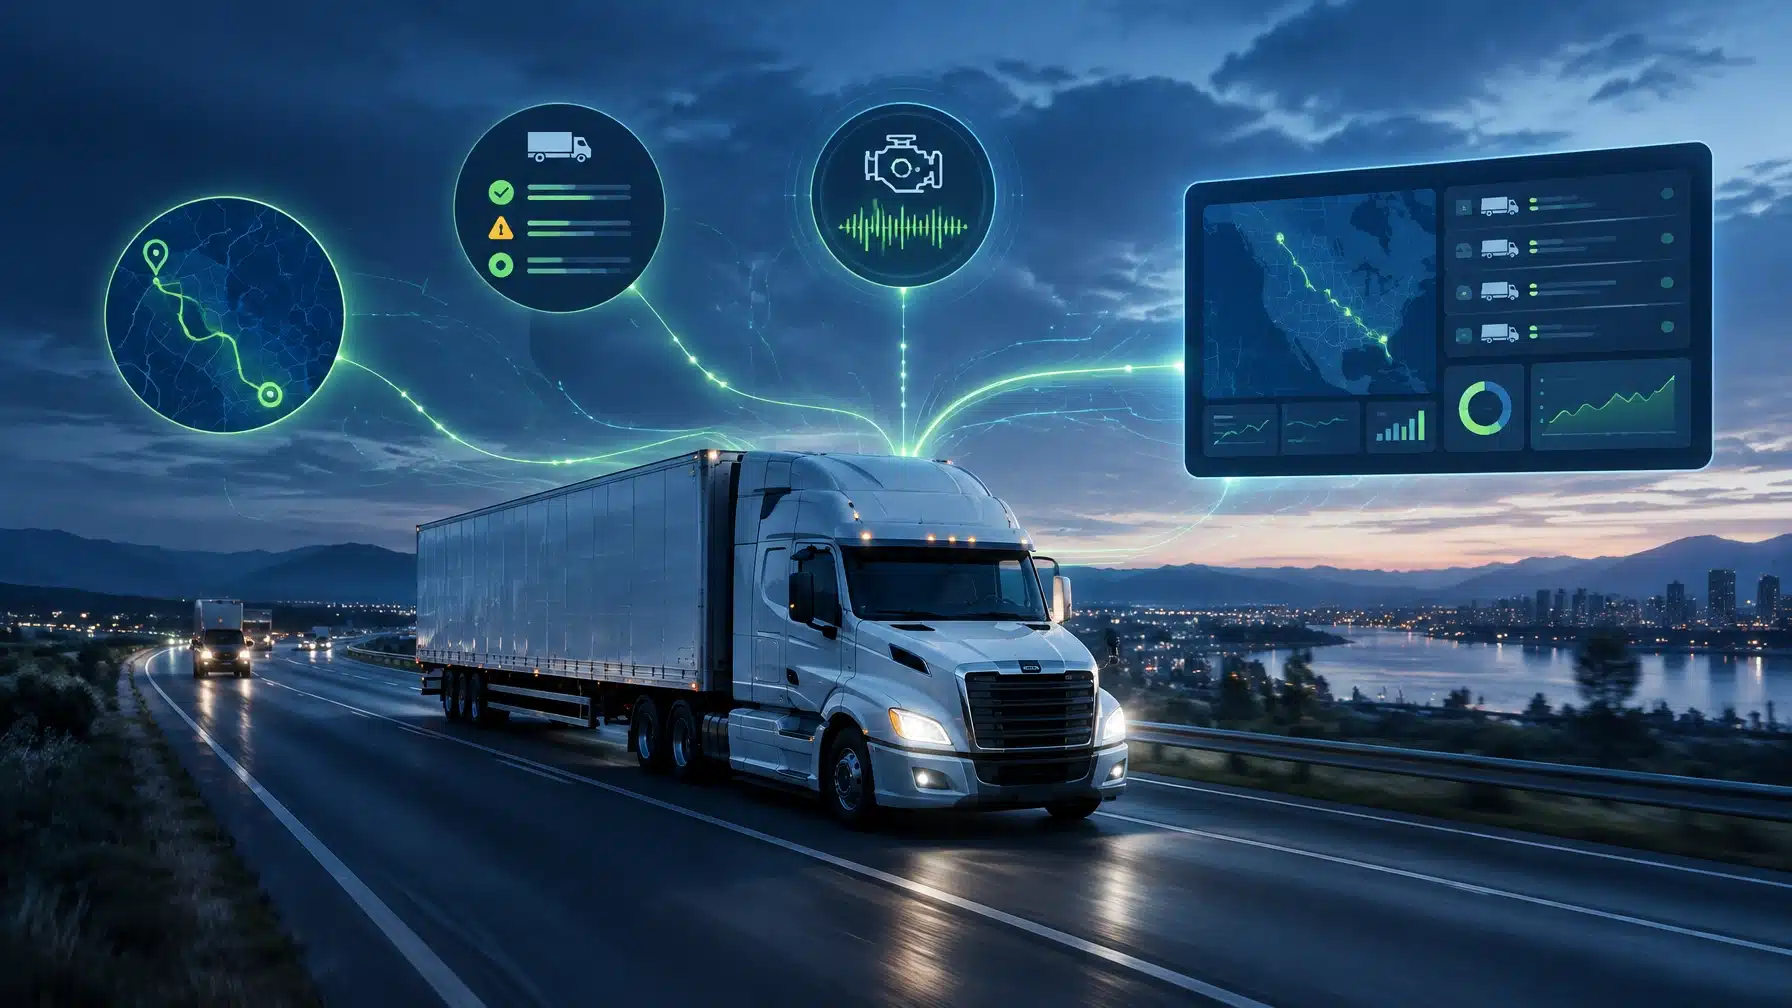
TL;DR: Fleet data often fails to inform decisions because it is split across telematics portals, transportation systems, ERPs, and spreadsheets; arrives after the moment to act; or appears in dashboards without useful context. Fleet data visibility connects relevant sources, clarifies status, and routes exceptions so teams can act on what matters.
Why doesn’t fleet data reach decision-makers?
Most fleet operations already collect substantial data: vehicle locations, diagnostics, delivery scans, driver activity, dispatch details, and service records. The challenge is not simply collecting more. It is connecting the information to the people and decisions that need it.
Three common gaps get in the way:
- Data lives in separate systems. Telematics may show where a vehicle is, while the TMS holds the load or order, the ERP holds financial details, and a spreadsheet tracks exceptions. Without reliable links between records, teams piece together the story by hand.
- Reports arrive too late. A report delivered the next morning may help explain a delay, but it cannot help dispatch respond while the vehicle is still on the route.
- Dashboards show activity, not answers. A map full of vehicle dots is not the same as knowing which job is at risk, who owns the next action, or whether a maintenance issue affects today’s schedule.
The American Transportation Research Institute’s September 2026 study of 111 motor carriers reflects the integration challenge: 29% of surveyed carriers used a TMS that was not integrated with telematics, and 39% did not integrate telematics with business transaction data. Nearly half-48%, did not integrate telematics with maintenance management software.
The practical takeaway is clear: more data does not automatically create more visibility. The value emerges when teams can connect the relevant events and act on them in time.

What does a real-time view actually look like?
A useful operational view puts the information behind a decision in one place. It may connect vehicle location to an order, show a status change against a service commitment, or surface a device alert alongside the asset and team responsible for resolving it.
“Real time” does not mean every data point must refresh instantly. It means information arrives at a pace that matches the decision. Dispatch may need current vehicle status; a weekly utilization review may not. We define the required timing, data sources, and exception rules around the workflow, not around a dashboard feature.
That view also needs context. A location becomes more useful when it relates to an assignment, expected arrival, or service area. A diagnostic code matters more when maintenance teams can see the vehicle, its availability, and the next step. The aim is to turn disconnected operational data into a clearer, real-time view of performance.
For Seisan’s approach to this work, see Operational Visibility and our Logistics and Fleet solutions.
How do you turn fleet data into action?
A visibility layer does not have to replace your TMS, ERP, or telematics provider. It connects useful information from the systems you already rely on, makes status easier to understand, and routes exceptions to the people who can respond.
A practical design starts with a specific decision:
- What should the team know? For example, whether a vehicle has arrived, a shipment is delayed, or an asset needs attention.
- What information supports that answer? Identify the relevant location, order, scan, diagnostic, or service records.
- How quickly does the information need to update? Set timing according to the action, source availability, and operational constraints.
- Who owns the exception? Define what triggers an alert, who receives it, and what happens next.
Then test the view with the people who will use it. A dispatch team, field coordinator, finance group, and maintenance team may need different details from the same underlying data. Role-specific views help each group find its answer without adding more noise.
What can real fleet data visibility deliver?
Seisan’s case studies show how connecting data to a clear operational task can reduce manual work and improve access to useful information.
For Asplundh, we integrated data from multiple sources and built a map-based dashboard to show work performed by spray trucks and rail spray trains. The previous process relied on spreadsheets containing 3,000 to 20,000 lines of service data per day. The dashboard let users filter activity by date and location, review service details, and verify work without navigating those spreadsheets manually.

For Flagger Force, Seisan connected in-vehicle GPS data with the company’s internal order system. The resulting tools gave teams a dashboard for real-time status and historical inquiries, helping them monitor assets and resolve field issues. The case study reports that, after deployment to all branches in Q1 2017, more than 93% of employees arrived on site on time.
For Hertz, we connected GPS devices to a custom fleet-security platform with vehicle tracking, alerts, history, and device diagnostics. The system gave security teams a more useful view of vehicle status and suspicious activity.
These examples are different by design. The right solution depends on what your operation needs to know, what systems hold that information, and which decisions are being delayed today.

What should you measure first?
Start with the decisions and outcomes your operation needs to improve, not with the longest list of available metrics. A useful first set often includes:
- Service status: arrival, delivery, or job completion against the expected time.
- Exceptions: delayed, missing, or conflicting events that need an owner.
- Utilization: how equipment and driver time are being used.
- Cost and productivity: measures such as cost per mile, fuel use, or revenue per mile where reliable source data is available.
- Maintenance readiness: diagnostics or preventive-maintenance status that could affect asset availability.
The ATRI study identifies cost per mile as the most important operations KPI among users it surveyed, while 73% reported using it. That difference between perceived importance and current use points to an opportunity, but only when the necessary operational and financial data can be connected and defined consistently.
Choose a small number of measures tied to decisions. Make their definitions clear, confirm that source data is dependable, and decide what action follows when a threshold is crossed. That creates a practical foundation for better fleet reporting and faster responses.
How do you know where to begin?
Look for a recurring question that takes too long to answer: Where is the vehicle assigned to this order? Which deliveries need follow-up? What caused today’s service delay? Which assets may affect tomorrow’s schedule?
Trace one workflow from data capture to decision. Note where people re-enter information, compare different reports, or wait for a status update. Then identify the sources involved and agree on what a useful answer looks like.
Seisan Consulting, based in Lancaster, Pennsylvania, works with organizations to connect systems and build operational tools around real workflows. We start by understanding the operating problem, then shape a practical solution around existing platforms, data access, and team needs. The result is not another dashboard for its own sake. It is a clearer path from information to action.
If your team is still reconciling GPS, order, and maintenance data by hand, the cost is not just administrative time. It is the decisions you cannot make while the information is scattered.
Book a working session with Seisan to diagnose one fleet workflow. Bring a reporting, status, or exception process that takes too long; we’ll discuss the data behind it and whether an operational visibility layer is a useful next step. Book a working session.
Frequently asked questions
What is fleet data visibility?
Fleet data visibility is the ability to see and interpret relevant information from fleet systems (such as telematics, orders, delivery events, and maintenance records) in a clear operational context. It helps teams understand current status, identify exceptions, and decide what to do next.
Why are fleet telematics data difficult to use?
Telematics data can be difficult to use when it remains separate from TMS, ERP, maintenance, or order information. Late reports, inconsistent records, and dashboards without workflow context also make it harder for decision-makers to act on the information.
Do we need to replace our TMS or telematics platform?
Not necessarily. A focused integration or visibility layer can connect information across existing platforms. The right approach depends on the workflow, data access, system capabilities, and support requirements.
Does fleet data visibility require every system to update in real time?
No. The refresh rate should match the decision being supported and the capabilities of the data sources. Some operational exceptions need timely updates, while planning and trend reviews can use less frequent refreshes.
What should a fleet operator measure first?
Start with a decision or operational question that matters, then choose a small set of related measures. Service status, exceptions, utilization, costs, and maintenance readiness can be useful starting points when definitions and source data are reliable.